


For YouTube operators, sustained growth does not rely solely on publishing more videos.
Truly mature YouTube operations is not about judging by feel "what content might go viral"; instead, it uses data to identify which content is worth continuing to invest in, which users are more likely to convert, and which stages affect video performance.
This article will introduce the 5 most important data metrics in YouTube operations and further break down environment management strategies in multi-account operation scenarios, helping you build a complete growth system from data analysis to execution and implementation.
Many creators encounter similar problems:
- Why do video views fluctuate up and down?
- Why do some videos get decent clicks but have very low watch time?
- Why has subscriber growth remained slow after the channel has been updated for a while?
Behind these problems is often not a matter of content volume, but a lack of systematic analysis of operational data.
The YouTube platform itself provides a complete data analysis tool, YouTube Studio, which includes important information such as user click behavior, viewing habits, traffic sources, and channel growth trends.
First, why must YouTube operations pay attention to data analysis?
Many beginners, when running a channel, usually rely on experience to judge content direction. For example:
- They think a topic is popular, so they immediately make a video;
- When they see a competitor has high view counts, they copy similar content;
- When they think a thumbnail design is attractive, they directly use a similar style.
But in actual operations, user feedback often differs from creators' expectations.
A carefully produced video may have a low click-through rate because its title is not attractive enough; a seemingly ordinary video may also receive a large number of recommendations because it precisely meets user needs.
The YouTube recommendation mechanism takes multiple factors into comprehensive consideration, including user click behavior, watch time, interaction, and content matching.
Therefore, operators need to use data analysis to find the key factors affecting growth, rather than simply relying on intuition to adjust content.
Two. Core metric 1: Click-through rate (CTR)—determining whether users are willing to open the video
Click-through rate (Click Through Rate) represents the proportion of users who click after seeing a video impression.
Calculation method:Click-through rate = video clicks ÷ video impressions
For YouTube, click-through rate is mainly influenced by two factors:Video titleandvideo thumbnail.
If a video has a high number of impressions but its click-through rate remains consistently low, it usually means that the title or thumbnail has not effectively attracted the target users.
Example comparison
Both are content aimed at Amazon sellers:
- Title A:How Amazon Sellers Can Increase Sales
- Title B:I Tested 100 Amazon Accounts and Found the Real Reason Sales Are Declining
Although the latter conveys similar information, it uses specific scenarios and numbers to create a stronger incentive to click.
When optimizing click-through rate, you should not simply pursue exaggerated titles; instead, you should ensure:
- The title's promise is consistent with the video content;
- The thumbnail can quickly convey the core message;
- Users can obtain the expected value after clicking.
Otherwise, even if the click-through rate increases, a decline in watch time may affect subsequent recommendations.
III. Core Metric 2: Watch Time and Audience Retention—Determines Whether the Algorithm Continues to Recommend
Many operators believe that view count is the core metric for measuring video success. But for YouTube, view count is only the result; the platform focuses more on user behavior after watching.
The most important data includes:
- Watch Time: The cumulative amount of time users spend watching videos
- Audience Retention: How users drop off at different stages of the video
How do you interpret a retention curve?
- If a large number of users leave in the first 30 seconds of a video, it means the opening did not quickly establish viewing interest;
- If there is a noticeable drop at a certain point in the middle, it may indicate that the content pacing is dragging;
- If retention remains relatively high at the end, it indicates that the content structure is relatively complete.
Therefore, when optimizing a video, you should not focus only on view count, but should analyze:
- Why do users stay?
- Why do users leave?
- Which part truly creates value?
IV. Core Metric 3: Engagement Data—Judging Users' True Engagement with Content
In addition to viewing behavior, user engagement is also an important indicator for judging content quality. It mainly includes:
- Number of likes
- Number of comments
- Number of shares
- Save behavior
Videos with higher engagement rates usually indicate that users not only watch the content but also engage further.
Example scenario
A cross-border operations channel publishes "5 Mistakes Amazon Beginners Are Most Likely to Make". If the comment section is flooded with:
- "I ran into this problem too"
- "Hope you continue updating this series"
This shows that the content truly triggered user demand. Operators can identify topic directions for the next phase through the comments.
Many excellent channels do not plan all their content in advance; instead, they continuously find new content opportunities in user feedback. For example, some leading tech review channels create an "Audience Q&A" series based on frequently asked questions in the comments, and the engagement rate of this type of video is often 2-3 times that of regular videos.
Five, Core Metric 4: Subscription Conversion Rate — Determining Whether Content Has Long-Term Value
Views can bring exposure, but only subscriptions can build long-term user assets.
Subscription conversion rate can help operators determine whether users are willing to continue following the channel after watching a video. Generally speaking, a YouTube channel's subscription conversion rate within 1%-3% is considered normal, while high-quality content can reach above 5%.
If a video has very high views but very few new subscriptions, it may indicate:
- The content solved a one-time problem, but did not build channel value.
Three Directions for Improving Subscription Conversion Rate
First, establish a clear channel positioning.
Users need to know: if they follow this channel, what content they can get in the future.
Second, create serialized content.
For example: Amazon product selection series, TikTok operations series, YouTube growth series. Continuous content makes it easier to build user expectations.
Third, guide viewers naturally in the video.
Rather than simply reminding users to "remember to subscribe," it is more effective to tell them what issue the next episode will continue to analyze, giving them a "reason to stay."
Six. Core Metric 5: Traffic Sources—Determining Channel Growth Direction
YouTube traffic primarily comes from the following sources:
- Suggested videos: Proactively pushed by the algorithm
- YouTube Search: Users actively search
- Browse features: Homepage recommendation feed
- External traffic: Traffic from other platforms
- Channel pages: Users actively visit
Different sources represent different growth models:
- Search traffic is high: It indicates that users are actively looking for your content, and your SEO optimization is effective;
- Recommendation traffic is high: It indicates that the algorithm is expanding content exposure;
- External traffic is high: It indicates that other platforms are helping drive traffic.
Operators need to regularly analyze the traffic structure to determine what stage the channel is currently in:
- Early stage of a new channel: You can acquire targeted users through search keywords;
- After content has accumulated: Need to improve video quality so the algorithm increases recommendations.
Seven. From Data to Execution: Environment Management for Multi-Account YouTube Operations
After you have determined a multi-market, multi-account operating strategy through the above data analysis, the next challenge you face is at the execution level—How can you efficiently manage the operating environment for multiple accounts?
For individual creators, analyzing the data of a single channel is already complex enough. But for cross-border businesses and content teams, they usually operate multiple YouTube accounts at the same time:
- Accounts for different country markets
- Accounts for different brands
- Accounts for different content directions
At this point, analyzing only individual video data is no longer enough. Teams also need to focus on:
- Growth trends across different accounts
- Content performance in different markets
- Operational efficiency across accounts
Example scenarios
- U.S. market accounts mainly publish product review content;
- European market accounts experiment with tutorial content;
- Asian market accounts explore short video content.
By comparing data from different accounts, you can identify content strategies that are better suited to the target market.
Core risk of multi-account operations: environment association
However, multi-account operations face an easily overlooked problem:Environment association risk.
If different accounts use the same device environment, browser parameters, or login information over a long period, they may trigger platform association detection, resulting in account throttling or even bans. This risk is especially prominent in the following scenarios:
- Multi-region operations
- Multi-person team collaboration
- Managing multiple brand accounts
- Testing different content directions
In these scenarios, keeping each account's operating environment independent is the foundation of ensuring account security.
P1 Fingerprint Browser: Building Independent Environments for Multi-Account Operations
P1 Fingerprint Browser (P1Browser)It can help teams create an independent browsing environment for each YouTube account, solving the issue of environment association at a fundamental level.
In YouTube multi-account operation scenarios, P1 can provide the following support:
Environment Isolation
Each browser window has independent cookies, local storage, and configuration profiles, which are not shared with one another, fundamentally blocking the risk of account environment association.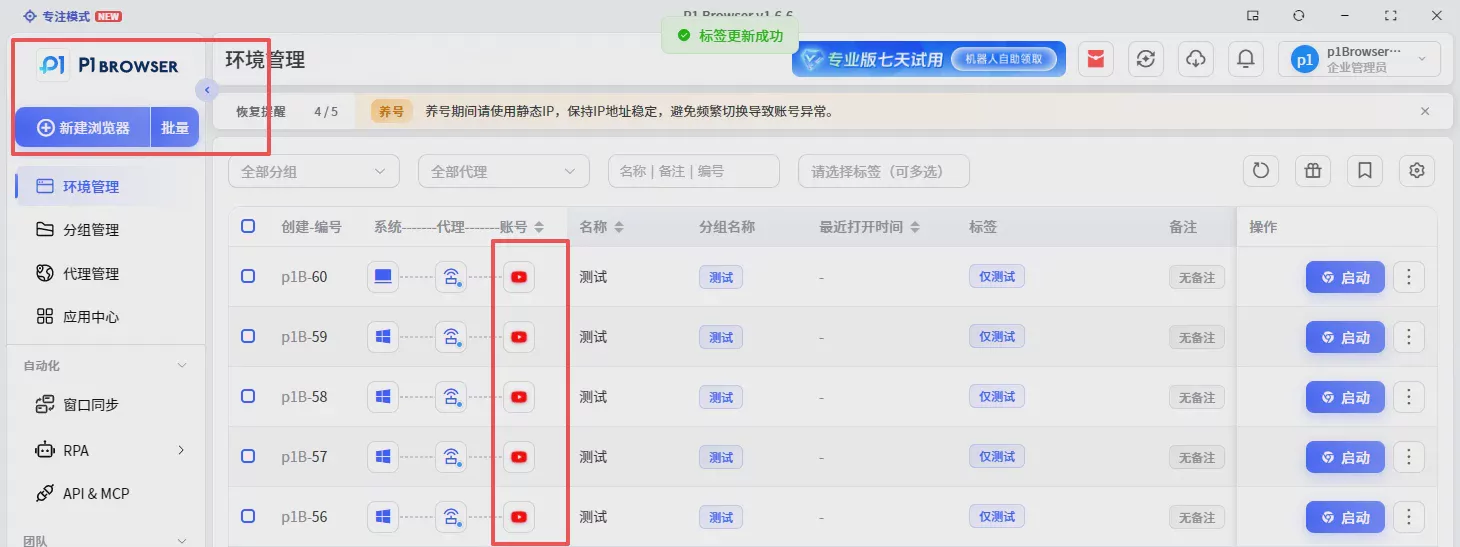
Fingerprint Parameter Configuration
Supports visual configuration of browser fingerprint parameters such as language, time zone, resolution, and WebGL. For example, an operations team can configure an English + Los Angeles time zone environment for US market accounts and a Japanese + Tokyo time zone environment for Japanese market accounts; each environment runs independently without interfering with the others.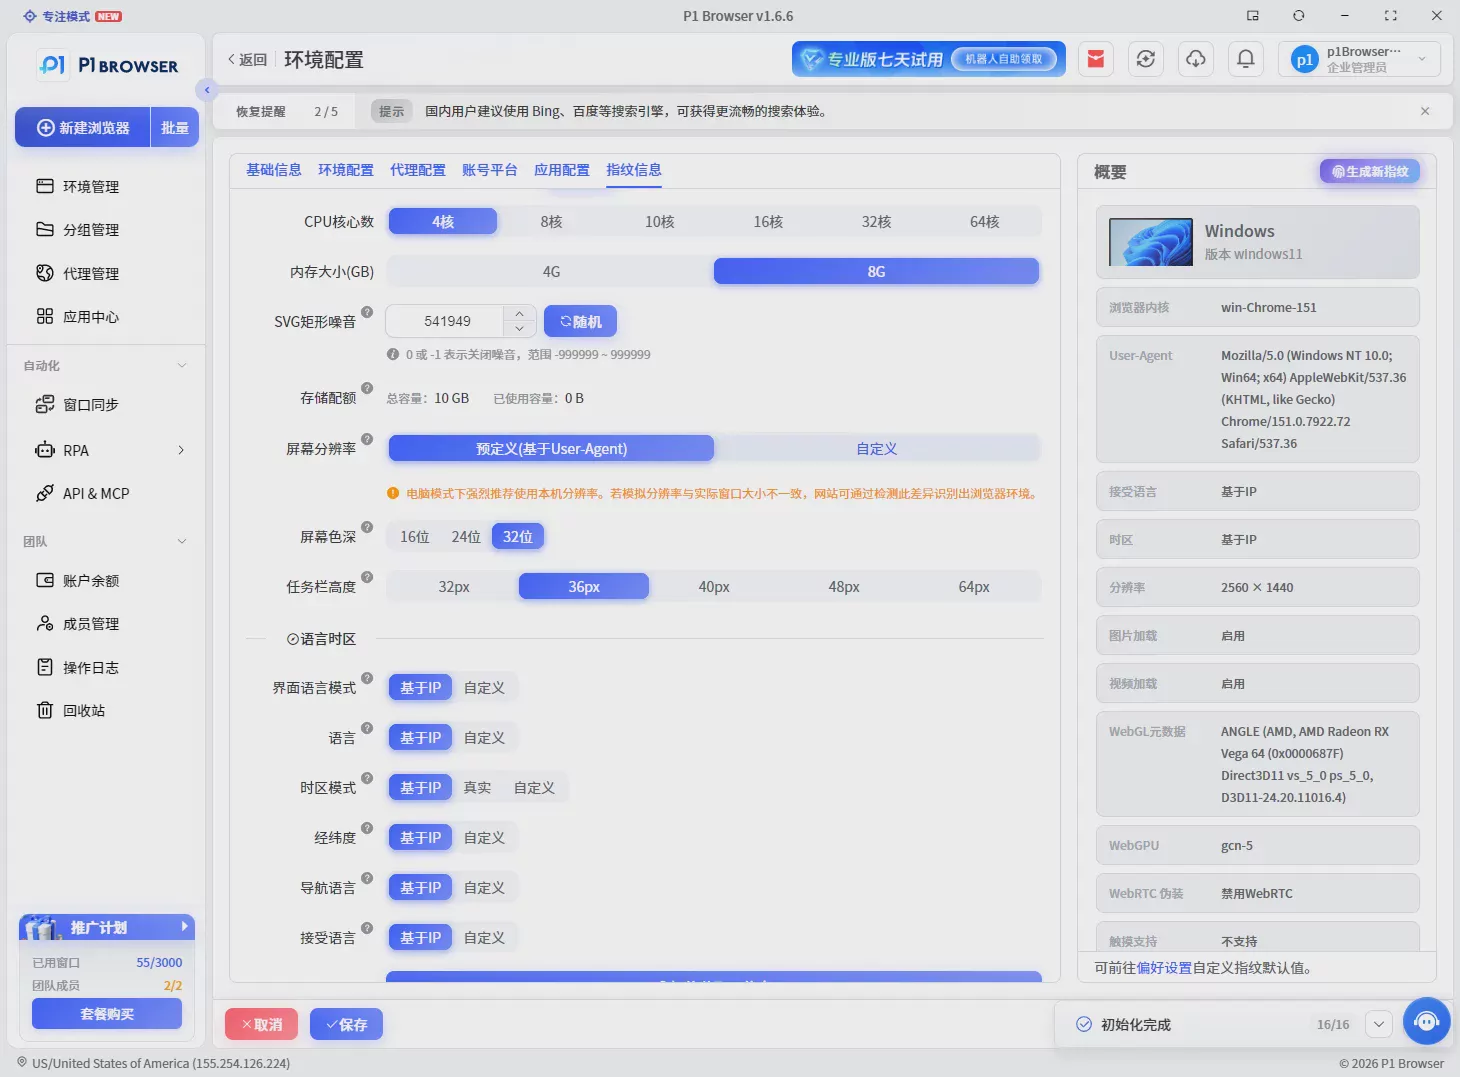
Proxy Binding
It is compatible with mainstream proxy protocols and supports binding different network egresses per window, enabling precise matching between accounts and IPs.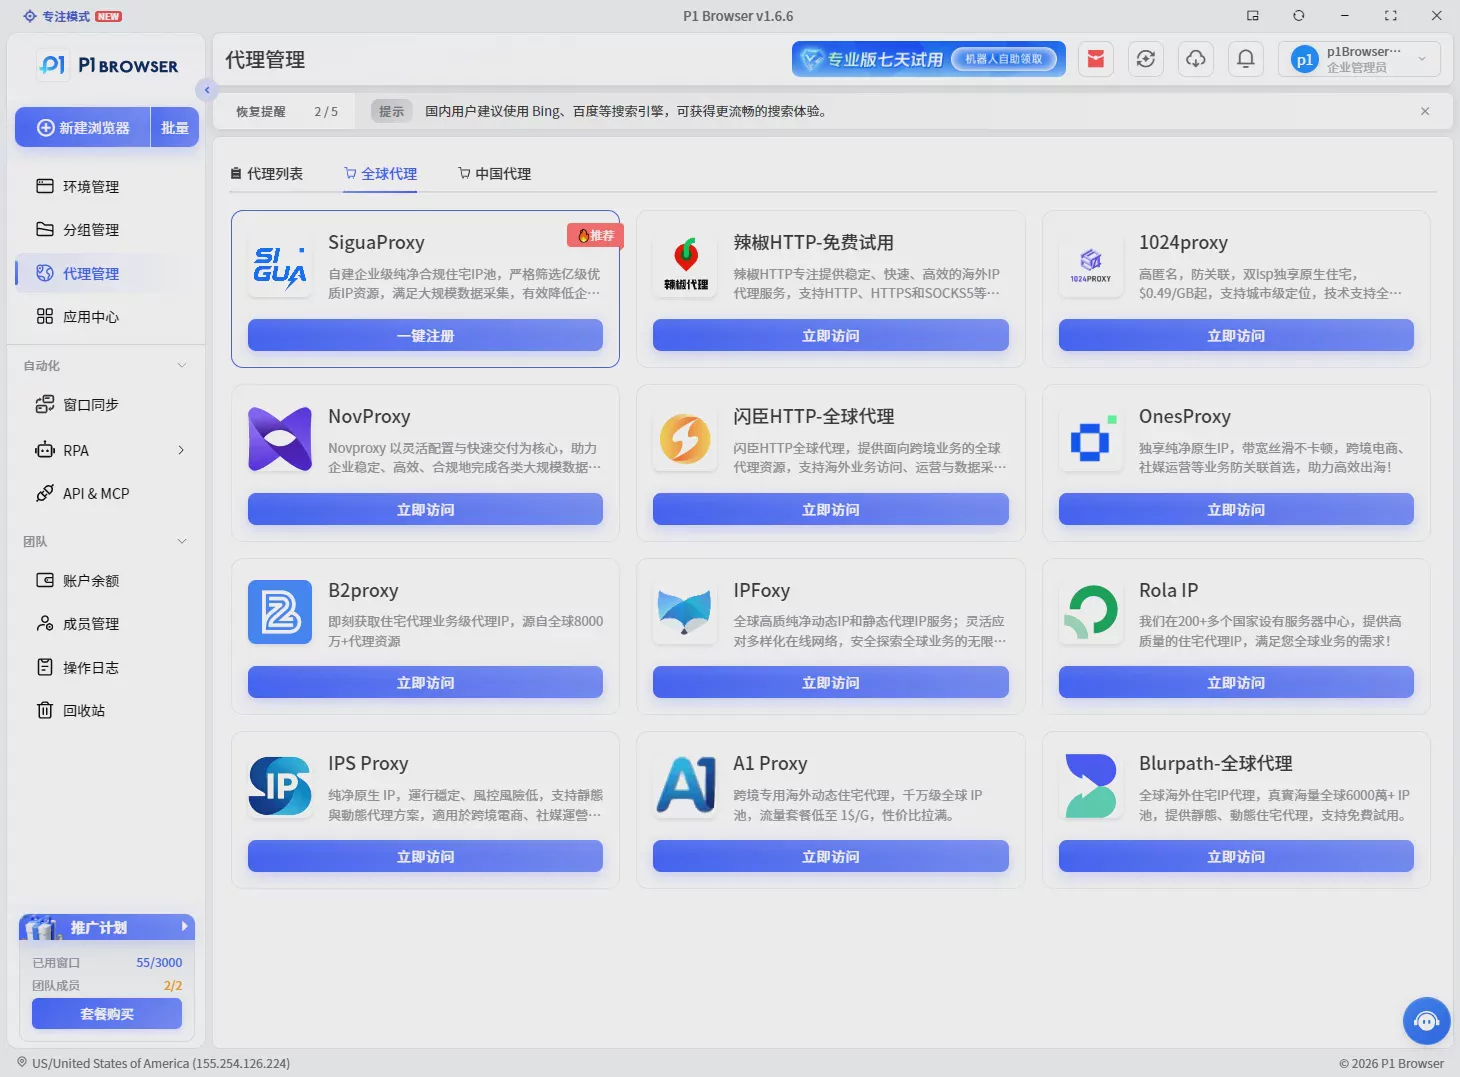
Team Collaboration
Built-in member grouping and tiered permission management features, supporting environment profiles and resource sharing. In an operations team, content creators can focus on video uploads and data analysis, while administrators can centrally manage account permissions, making the division of labor between accounts clearer and permissions more controllable.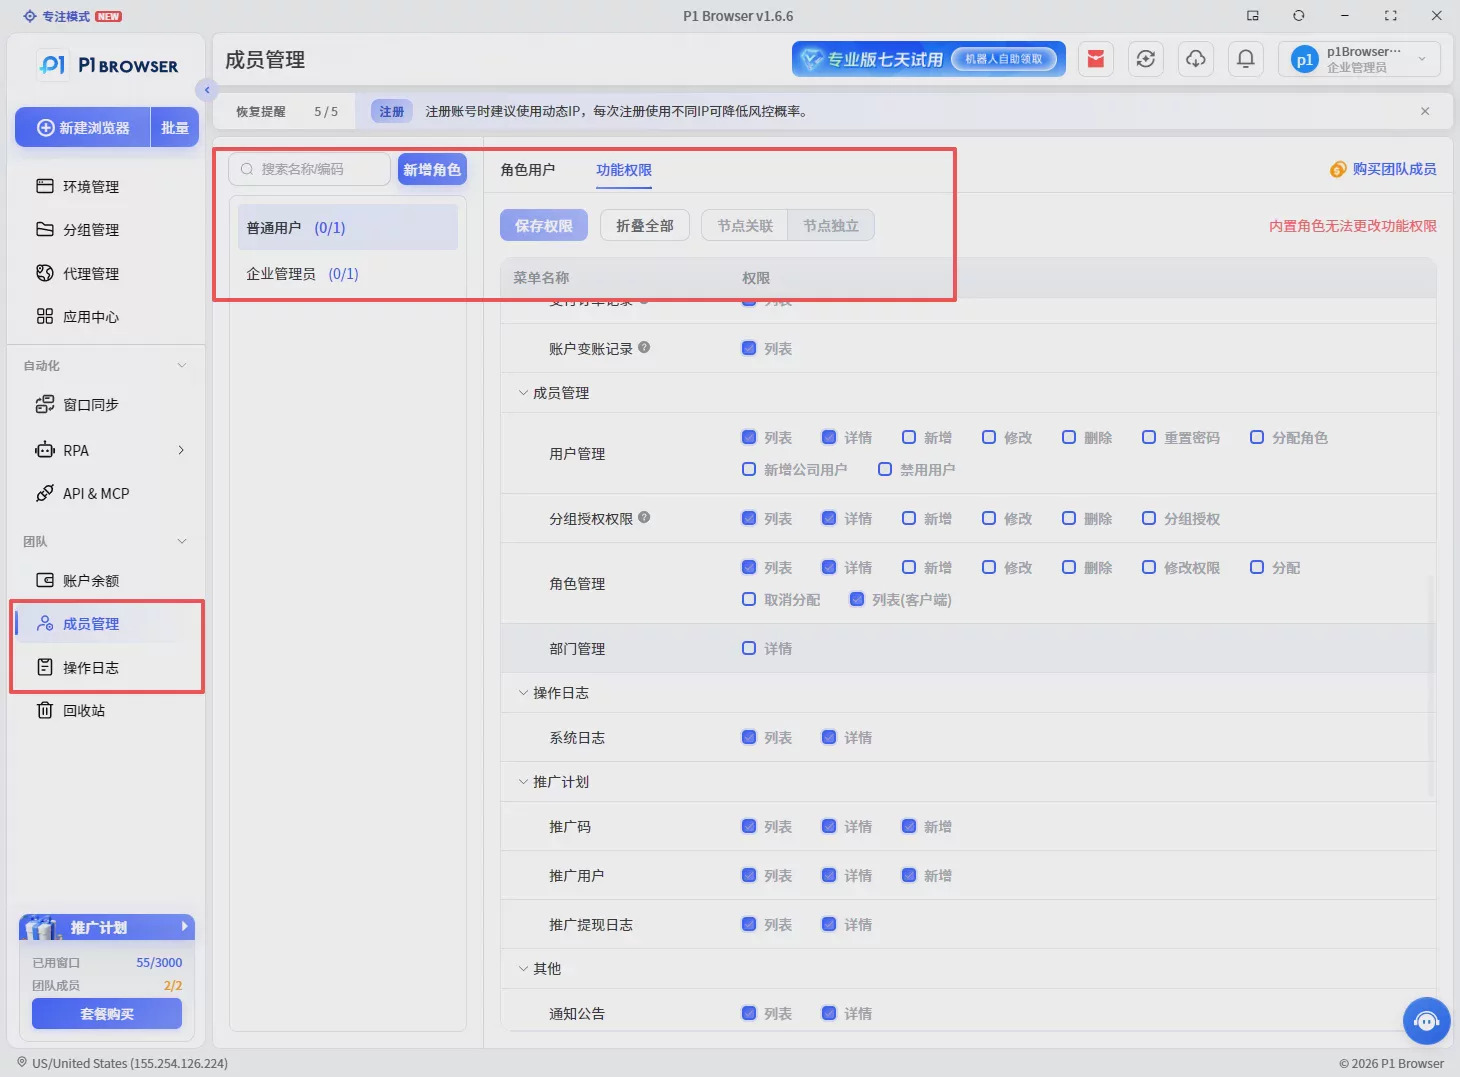
Part Eight: How to Build a YouTube Data Analysis Process?
A complete data review process typically includes:
The first step: review the channel's overall data every week.Analyze views, watch time, and subscriber trends.
Second step: Analyze top-performing videos.See which titles, thumbnails, and content structures drive higher clicks and retention.
Step Three: Analyze underperforming videos.Identify where users drop off and determine whether the issue lies in topic selection, packaging, or content structure.
Step four: Create a content optimization record.After long-term accumulation, you can build your own content database.
The value of data analysis is not to explain the past, but to help operators predict the future.
Summary: Data-driven + tool-empowered to achieve sustained YouTube growth
YouTube operations is not simply about publishing videos. Channels that truly achieve sustained growth are constantly adjusting their content strategies through data:
- Click-through rateDetermines whether users open the video;
- Watch timeDetermines whether the content is worth recommending;
- Engagement dataReflects the level of user approval;
- Subscription conversionDetermines long-term value;
- Traffic sourcesDetermines the direction of growth.
For individual creators, building a data analysis system allows them to gradually shift from "publishing content" to "operating a channel".
For enterprise teams, in multi-account, multi-market operations, in addition to data-driven content optimization, they also need professional tools to ensure the security of the account environment.
P1 fingerprint browser can build an independent, stable operating environment for each account, while its team collaboration features improve multi-account management efficiency, making YouTube matrix operations safer and more efficient.
If you are also running multiple YouTube accounts and want to configure an independent, stable browsing environment for each account,
visit the official P1 fingerprint browser website (www.p1go.com) to learn more